Monitoring tumors in the liver
One of my favorite computer vision case studies is about Amsterdam University Medical Center or AUMC. AUMC provides patient care, conducts scientific research and is also a teaching hospital. They are using computer vision from SAS to monitor the progression of tumors in the liver using DICOM images from CT scans. DICOM stands for Digital Imaging and Communications in Medicine.
Colorectal cancer is the third-most common cancer worldwide, and sadly it spreads to the liver in about half the patients. Those patients with large tumors may need to undergo chemotherapy to shrink them, prior to being considered as candidates for surgical removal.
After a treatment period, the tumors are manually evaluated by radiologists using CT scans. At that time, radiologists can see if a tumor has shrunk or if its appearance has changed. The results of this evaluation determine the next steps for a patient’s plan of care, such as surgery or the application of a different chemotherapy regimen (drugs, dosages, timing) or other alternatives.
This workload intensive approach presents many challenges to radiologists.
- Evaluating tumors is a time-consuming process for radiologists.
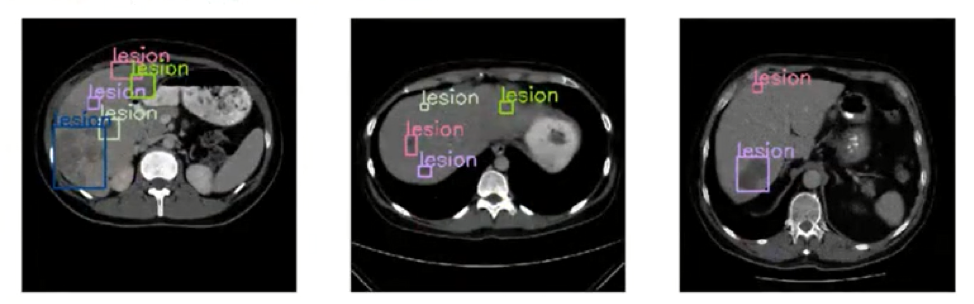
- And for each CT scan, typically only the two largest tumors are measured – possibly missing information hidden in any remaining tumors.
- Furthermore, the manual assessment is prone to subjectivity, which may result in different evaluations amongst a team of radiologists.
The project started by training a deep learning model with data from 52 cancer patients. Every pixel of 1,380 metastases was analyzed and segmented. This taught the system how to instantly identify tumor characteristics.
The deep learning model used was image segmentation, which is used in computer vision. Image segmentation takes an image and breaks it down into multiple segments to make it easier to analyze. Without computer vision, it would be a very difficult manual task to identify the segments, especially when the contrast is low between the lesion and the organ.
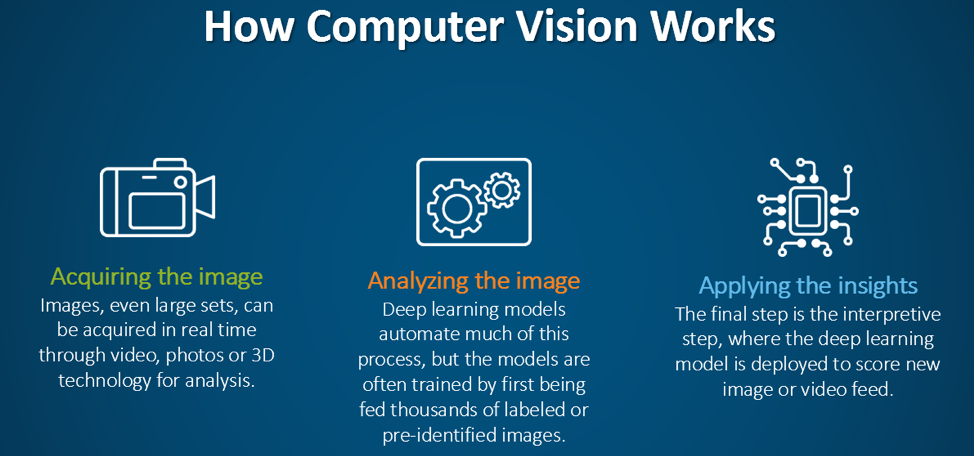
Acquiring the image: To begin with, the DICOM images and DICOM- RT contours were loaded. These contain the anatomical images of the liver and contour maps of both the tumors and the liver. Note that the contour maps are DICOM RT images, whereby RT stands for radiation therapy. Both the images and the contours are needed for image segmentation.
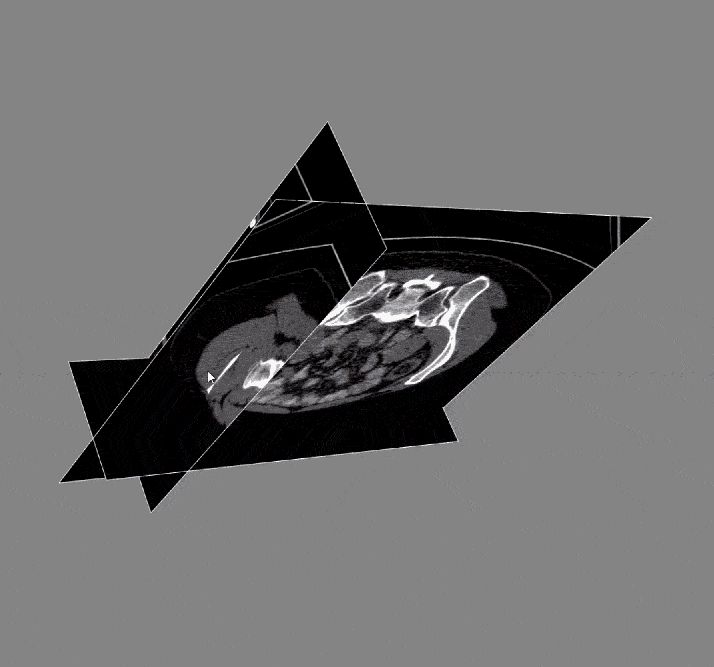

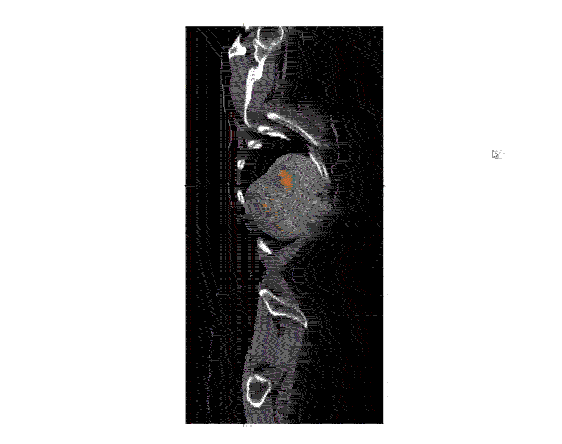
After the images were merged, the contours (a list of points) were converted to 512 x 512 mask image that were then input to create a 3D representation of the liver and tumors.
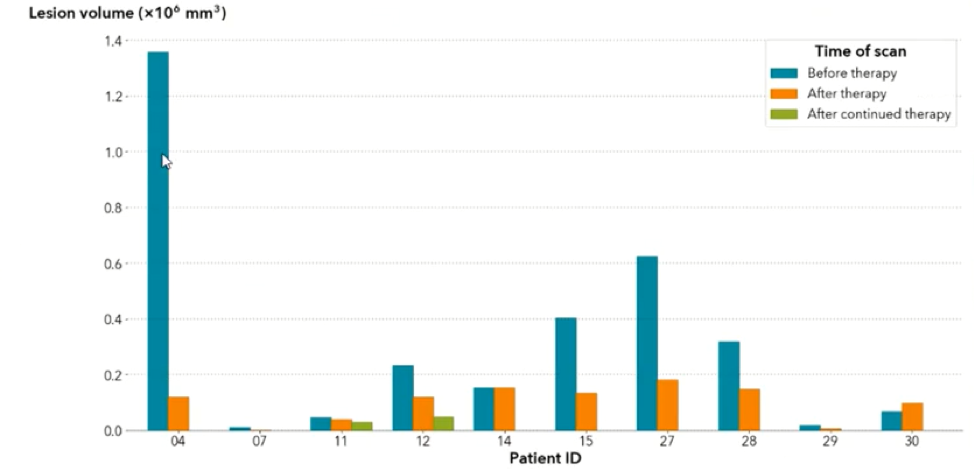
Analyzing the image: The real question is just how big is the tumor? To answer this, the mask image must be quantified by calculating the 3D volume of the tumor. The results of the calculations can the be plotted to communicate this information to the physicians. In the graph below, the tumor volumes are shown in the various stages of treatment.
Then, deep learning models are trained to identify the tumors using an object detection model. An object detection model is used because you want to identify a specific item in the liver, which in this case is a tumor. Object detection models place a bounding box around each tumor that is present and label it is a lesion. The computer vision model used for object detection in this case is a tinyyolov2 model.
Applying the insights: After the deep learning model is trained, it can then be deployed to evaluate new images.
This analysis was done using Jupyter notebook in combination with the biomedical (BioMedImage) action sets from SAS Viya and SAS Deep Learning with Python (DLPy).
Ultimately, computer vision can augment radiologists and make the image interpretation process cheaper, faster and more accurate. The ultimate goal is to achieve a better patient outcome facilitated by the use of computer vision.
To learn more, please check out these resources:


1 Comment
Susan, thanks for the post. Appears to be great potential in computer vision for this sort of application, particularly with the problem of subjectivity in human assessment. As a somewhat related sidenote, in a study published in Psychological Science (Drew, Võ, & Wolfe, 2013), radiologists were asked to examine scans of patients’ lungs and search for nodules indicative of cancer. One of the scans included an image of a gorilla that is obvious when you are looking for it, yet apparently not so obvious when you are looking for something else. Although the gorilla is 48 times the size of the typical nodule, and eye tracking showed most of the radiologists looked right at it, 83% of them failed to notice.